Markers, line styles and panel labels
Markers
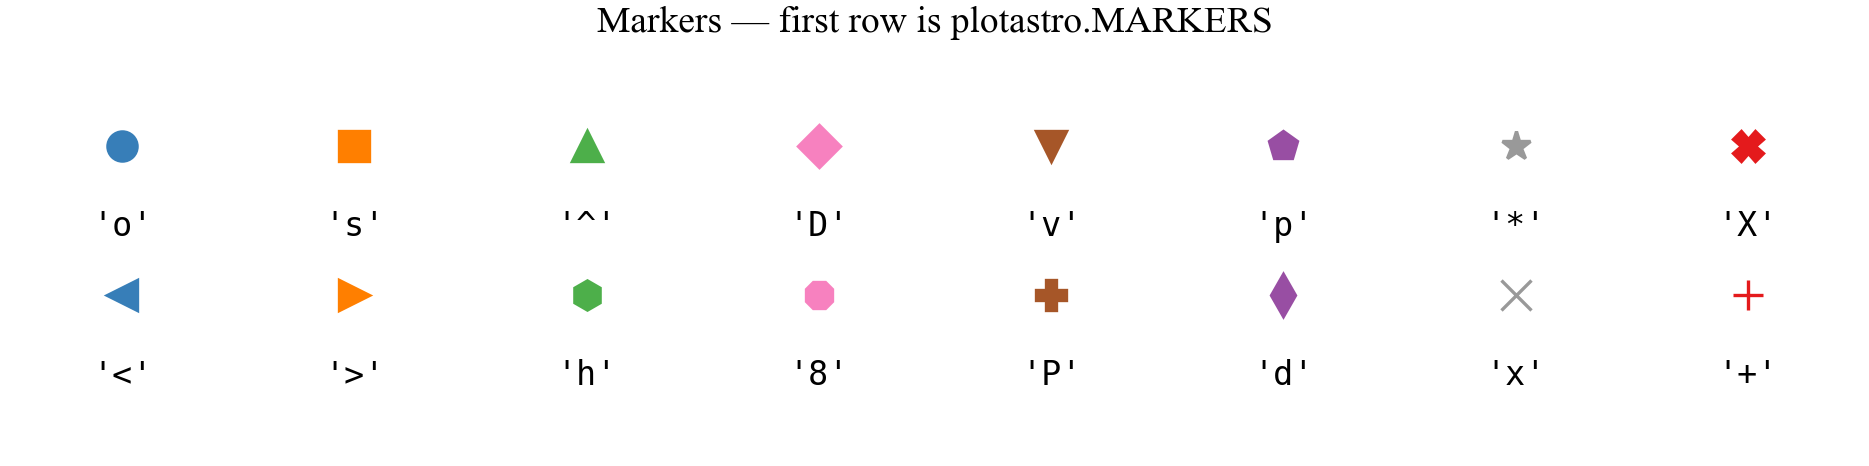
plotastro.MARKERS = ["o", "s", "^", "D", "v", "p", "*", "X"] — filled
shapes that survive shrinking to 4 pt. Conventions worth knowing:
marker |
typical use in astro figures |
|---|---|
|
primary data series |
|
lower / upper limits (readers expect this) |
|
highlight special objects (the Sun, a best-fit point) |
|
thin crosses — dense scatter plots, since they don’t occlude |
|
huge point clouds (use |
Useful tricks: markevery=7 thins markers on dense curves; mfc="none"
(hollow markers) keeps overlapping datasets readable; ms= and mew=
control size and edge width.
Line styles
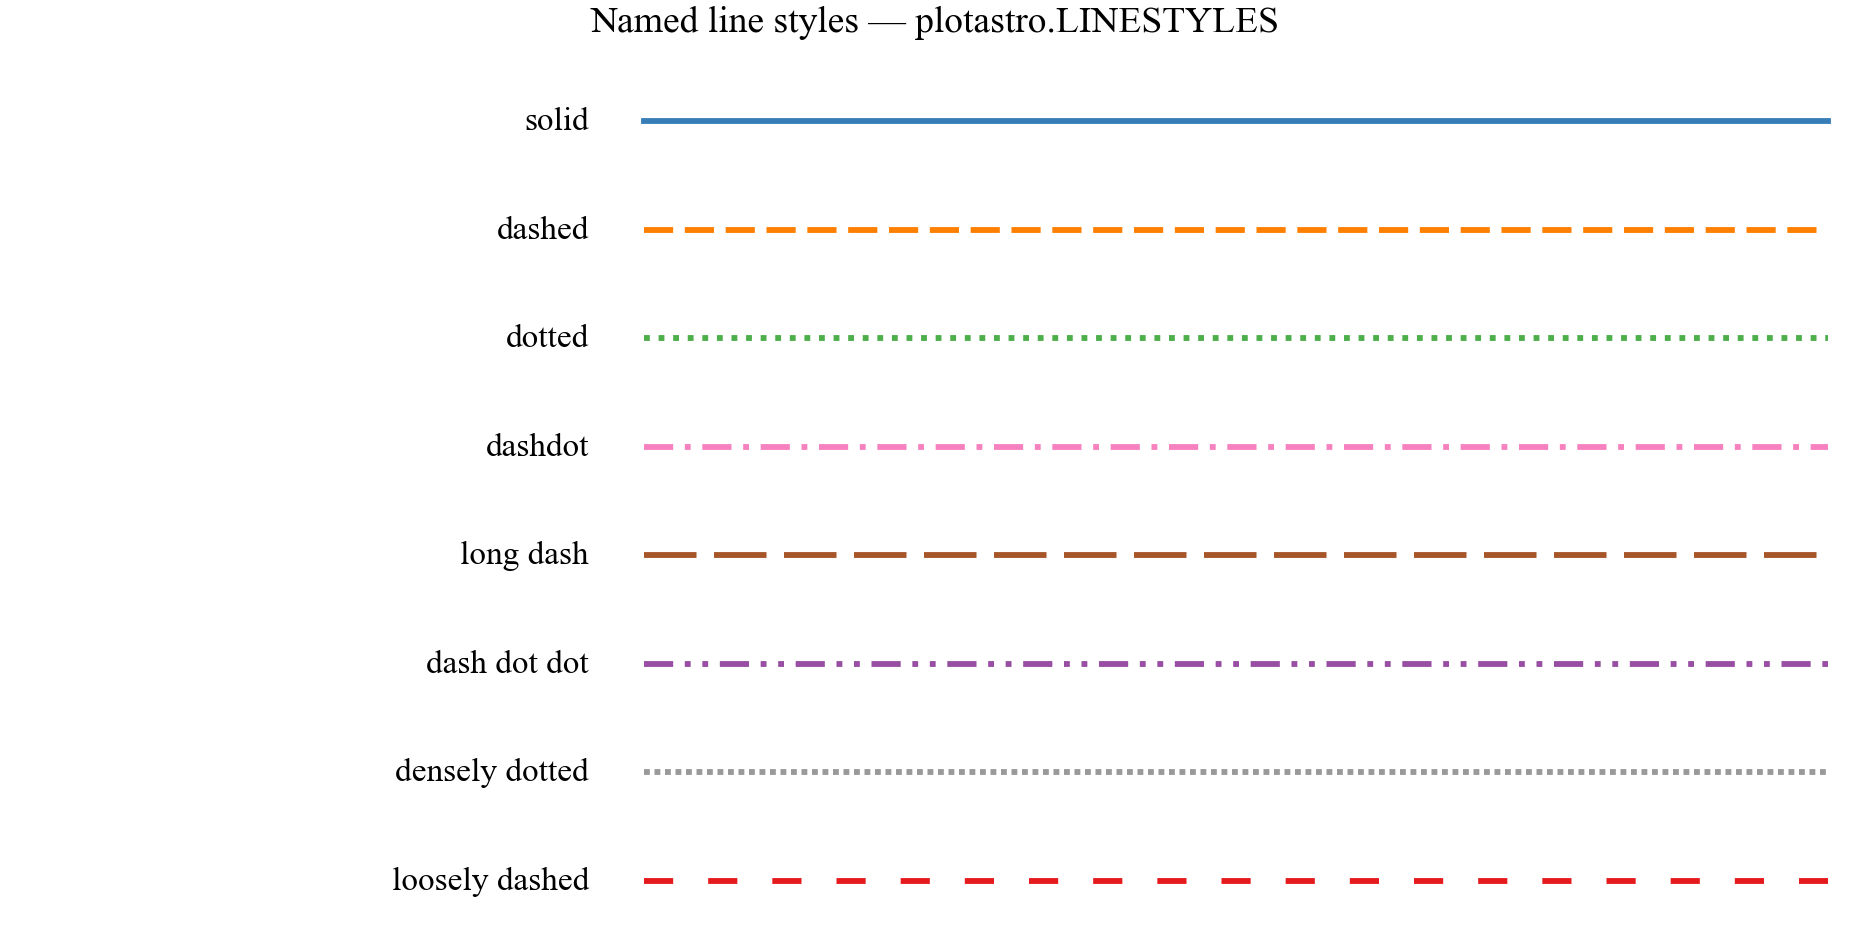
Beyond matplotlib’s "-", "--", ":", "-.", the dict
plotastro.LINESTYLES provides named dash tuples of the form
(offset, (on, off, ...)) in points:
ax.plot(x, y, ls=pa.LINESTYLES["long dash"])       # (0, (9, 3))
ax.plot(x, y, ls=(0, (4, 1, 1, 1)))                # or roll your own
Guidelines: keep to ≤ 4 distinct dash patterns per panel (more becomes noise); use solid for data / the headline result and dashes/dots for models and references; MNRAS explicitly warns against triple-dot-dashed lines.
Redundant encoding — the cycler
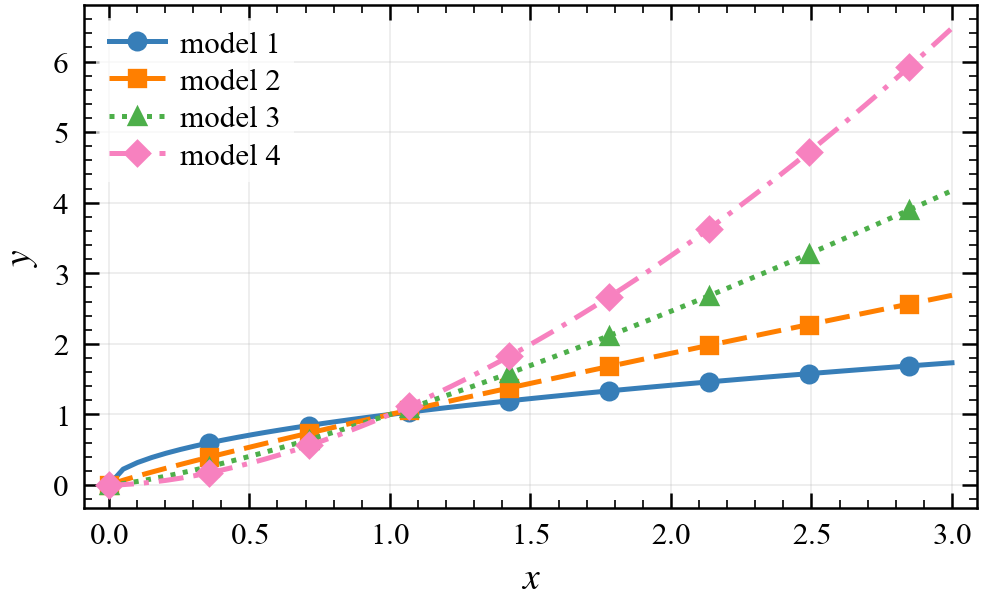
Colour should never be the only difference between curves.
plotastro.style_cycler() advances colour, marker and/or line style
in step, so every series is unique in two or three channels at once
(and survives greyscale printing):
ax.set_prop_cycle(pa.style_cycler(markers=True))              # one axes
ax.set_prop_cycle(pa.style_cycler(linestyles=True, markers=True))
plt.rc("axes", prop_cycle=pa.style_cycler(markers=True))      # everywhere
Panel labels
Journals want multi-panel figures labelled (a), (b), (c)… —
plotastro.label_panels() does it in one line, in reading order:
fig, axes = pa.subplots(2, 2, width="full")
pa.label_panels(axes)                                    # (a) (b) (c) (d)
pa.label_panels(axes, loc="outside", fmt="{}", fontweight="bold")  # Nature style
pa.label_panels(axes, uppercase=True, loc="lower right") # (A) ... bottom-right